MONITORING MEMORY USAGE
Under Construction
Monitoring Memory Usage While Running on the Cluster
This page provides tips for monitoring your memory usage so that you don’t OOM (Out of Memory) errors while simultaneously learning how to be a good steward of cluster resources so that job throughput is increased which benefits all of us (and most importantly your jobs!)
Rationale
One issue that we see frequently on the Longleaf cluster is that users over-request memory and then don’t use it. The problem with this is that other jobs that could productively use that (unused!) memory can’t run and so are delayed. These delays add up, throughput is reduced and everybody suffers. By appropriately specifying your memory needs, this problem can be alleviated. Note, the goal here is not to get perfect memory usage, but to avoid egregious memory requests. For example a job that requests 100 GB but only needs 10 GB is off by a factor of 10x and wastes a lot of memory. The same job would run just as fast and just as well if it requested 12 GB of memory. (Requesting more memory does not make your program run faster when there the program doesn’t use it). If you are within several GB of what you need then there is no need to worry but if you are leaving 10’s of GB on the table then maybe it’s time to address this problem.
How do I know how much memory my application used?
There are three ways to find your memory usage, which is denoted by MaxRSS (Maximum Resident Set Size). The commands seff, sacct, and sstat all query the SLURM database to get this information. We recommend seff as the easiest and clearest of the three to use, while sacct can give additional information and sstat is useful for querying running jobs.
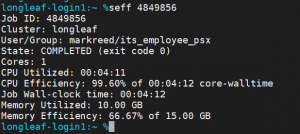
seff
After the job completes, you can run seff <jobid> to get some useful information about your job, including the memory used and what percent of your allocated memory that amounts to. Here is an example.
sacct
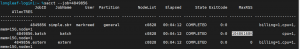
You can also use the more flexible sacct to get the same memory information, along with other more advanced job queries. To get the memory you will have to run this after the job completes. Unfortunately, the default output from sacct is not as useful. You can specify exactly what to output you want but be warned there are more than 100 fields to choose from, see “man sacct” for full details. A convenient shortcut is to set the environment variable SACCT_FORMAT to a format string you find useful and this will be your default. Here is an example. (Note: the %xx specifier sets the width of the output field to xx characters wide and overrides the default).
export SACCT_FORMAT=”JobID%20,JobName,User,Partition,NodeList,Elapsed,State,ExitCode,MaxRSS,AllocTRES%32″
sacct -j <jobid> or equivalently sacct –jobid=<jobid>
You should look at the MaxRSS value to see your memory usage.
sstat
You can use sstat to get information on a running job. For example
sstat -j <jobid>