GPU Monitoring Tools
Research Computing makes many types of NVIDIA GPUs available through the Longleaf cluster and the Open OnDemand web portal. Because of the demand and cost of GPU resources it's important to target the appropriate GPU for your code. You will want to target a GPU model type so that your code makes sufficient use of the GPU's memory and cores. This article discusses three tools you can use to monitor the GPU memory usage and utilization of your code: nvidia-smi, nvtop, and atop. By using these tools you should be able to figure out which GPU is most appropriate for a given code and therefore target the appropriate GPU.
Using Nvidia-SMI
The NVIDIA System Management Interface (nvidia-smi) is a NVIDIA command-line utility which can be used to monitor the performance of NVIDIA GPU devices.
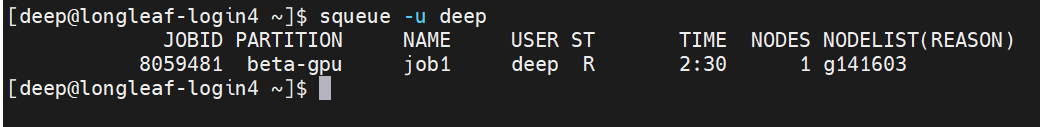
Once your job is running on a Longleaf GPU node you will need to determine the host your code is running on and you can do this using the squeue command
squeue -u <onyen>
For example, I can see my job is running on host g141603. You can also get your job's ID number from the squeue command. In my case the job's ID number is 8054170.

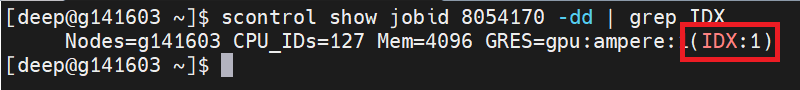
Next use the SLURM scontrol show jobid command with your job's ID number to identify the exact GPU device your code is running on:
scontrol show jobid 8054170 -dd | grep IDX
So, here the GPU device being used by my job is device 1.
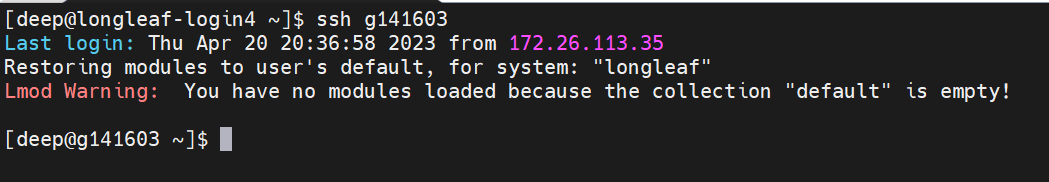
You can now ssh into the host your job is running on to check your job's GPU usage.
Once on the host, run the nvidia-smi command; to target a specific GPU you can use the --id option where the value is the device number to target. Since my code is running on device 1, I've set the id argument to 1.
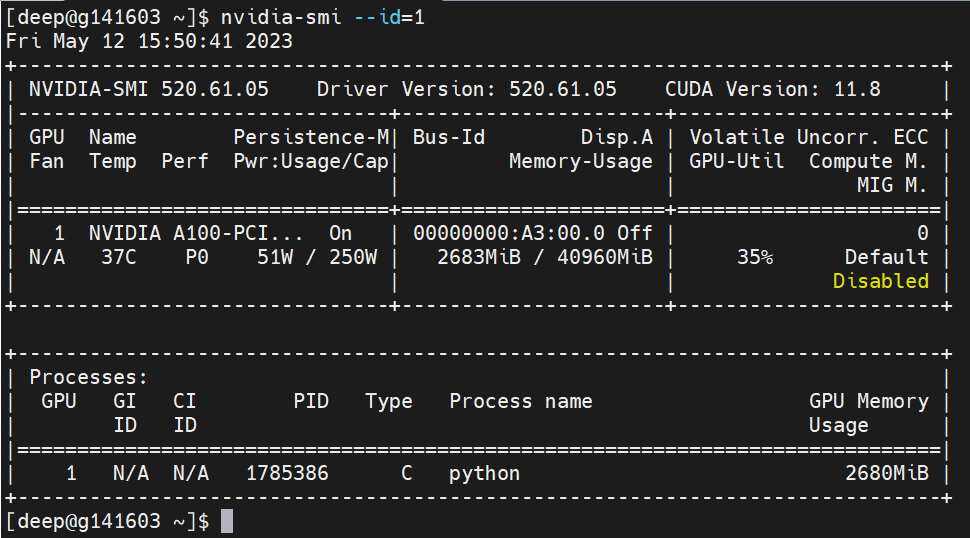
In the top panel GPU 1 is at 35% utilization and the memory usage is 2683 MiB / 40960 MiB (~ 7%). So, at the point I ran the nvidia-smi command, the code was using about 7% of the GPU's memory and 35% of the GPU's available compute.
Note nvidia-smi only provides a snapshot of the GPU. We suggest monitoring your GPU for a few iterations of your code to get a sense of the maximum GPU memory usage and utilization of your code. A useful tool you can use for this task is the Linux watch command. For example, the watch -n 2 nvidia-smi --id=1 will run the nvidia-smi --id=1 command every two seconds thus automatically providing updated measures of GPU utilization and memory every two seconds. To quit the watch command you can do Ctrl-C.
After you have finished your monitoring, be sure to exit the node by typing exit and hitting Enter.
Using NVTOP
Similar to the nvidia-smi command discussed above, you'll need to ssh into the host on which the job executing your GPU code is running
(details of how to do this are in the previous section). Once, on the host you can simply run the
nvtop
command. This command produces a nice, easy to read graphical display of the state of the GPU devices.
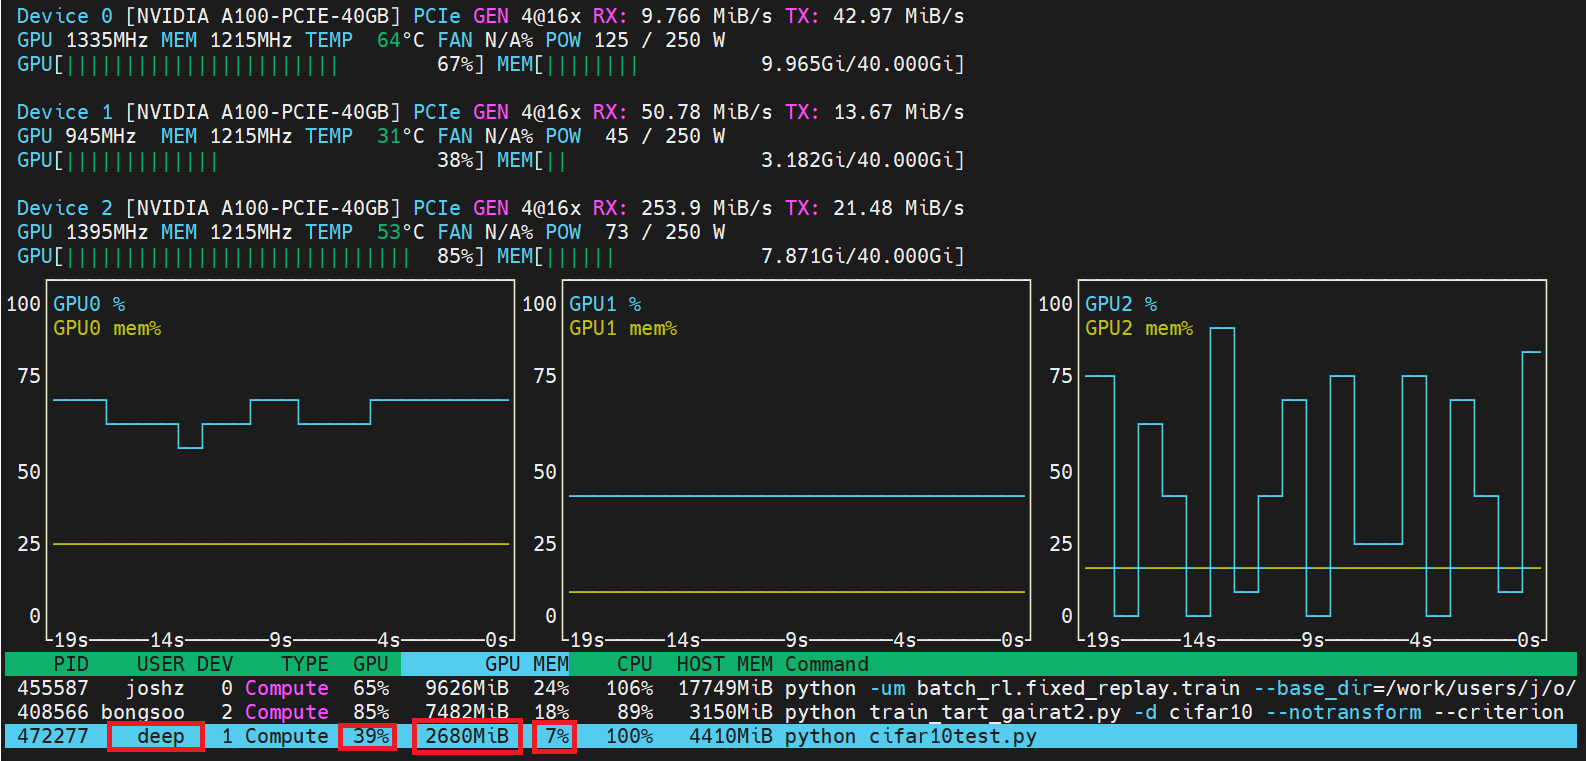
After finding the process corresponding to your code in the bottom panel, by looking for your user ID (i.e., ONYEN) under the USER column, you can examine the GPU and GPU MEM columns to get the GPU utilization, GPU memory usage, and GPU memory utilization for your process. A nice feature of nvtop is that the output automatically updates.
Here, I can see my process is using 39% of the GPU and 7% of the GPU's memory (i.e., 2680 MiB of GPU memory).
After you have finished monitoring, be sure to exit the node by typing exit and hitting Enter.
Using ATOP
The atop command is a powerful UNIX command-line utility for monitoring system resources and performance. It provides real-time information about various aspects of the system, including the CPU, GPU, memory, disk, and network usage. A nice feature of atop is that it logs system activity in 10-minute intervals (by default). So, in our case we will use it to monitor GPU usage of a running job over time. Instead of using atop directly, we'll use atopsar to generate a report.
You will need to know the node your job is running on and the day for which you want to generate a report. Since we are specifically interested in getting GPU statistics, it will help to have the GPU device number your job is using. As explained before, you can get the node your job is running on by using the squeue command and you can get the GPU device number using the scontrol show joid command.
As an example, I currently have a job running on the GPU node g141603.
and I've already determined that the job is using device 1. Using scontrol show jobid you can also get the start time of the job, so here I can see my job started on 5/12/2023 at 17:36:34.

At this point I have everything necessary to run atopsar and generate a report of gpu statistics for node g141603 for the date 5/12/2023:
ssh g141603 atopsar -g -r /var/log/atop/atop_20230512 | less
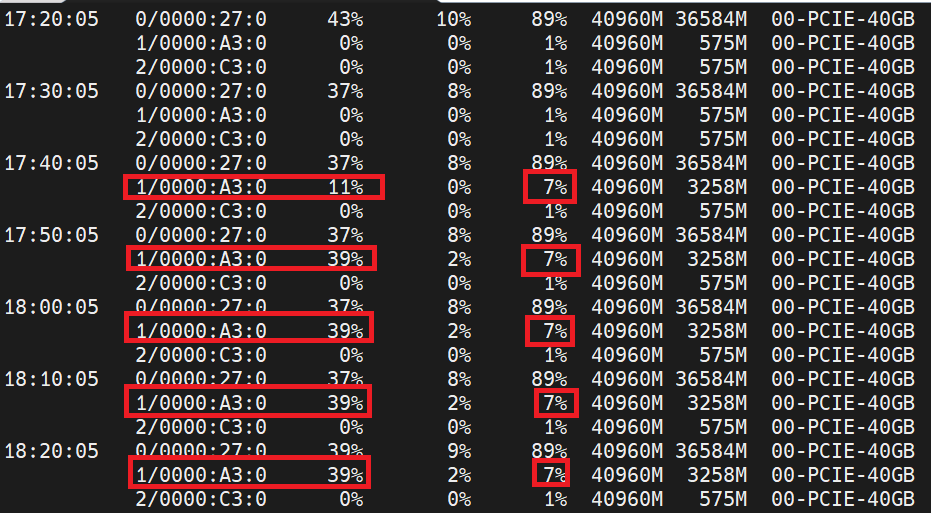
In my case, the relevant logging information is in the file atop_20230512 (the atop log files are named according to the date) since that's the day my job started running. The -g flag tells atopsar to display fields related to GPU utilization.
The first column is the time stamp (in 10-minute intervals), the second column is the GPU device the data corresponds to, the third column is the gpu utilization, and the fifth column is the gpu memory utilization. You can use the spacebar to scroll through the report and look at specific time intervals of interest. Here I've jumped to the time interval corresponding to around when my job started and displayed the results for the first few intervals. Hit q to quit.
A few things to keep in mind are
- The atop log files are available going back approximately a month in time.
- If there are empty fields corresponding to a timestamp that means the gpu was not being utilized at that time.
- If a report fails to get generated that indicates the atopgpu service was not running at the time of logging. If this happens for an actively running job, please email research@unc.edu to let us know.